파일 하나로 FFT 주파수 분석
설명
CSV·엑셀·WAV 어떤 파일이든 열어 신호의 주파수 성분과 주요 피크를 찾아요
필요 데이터
CSV·Excel·WAV 파일 (신호 컬럼은 실행할 때 선택)
출력
시간 영역 + FFT 스펙트럼 그래프, 상위 피크 표
필요 패키지
- numpy
- pandas
- matplotlib
- scipy
태그
science, timeseries
작성자
MDS 메이커 | MDS 1.0

CSV·엑셀·WAV 어떤 파일이든 열어 신호의 주파수 성분과 주요 피크를 찾아요
Open any CSV/Excel/WAV file and find its frequency components and top peaks
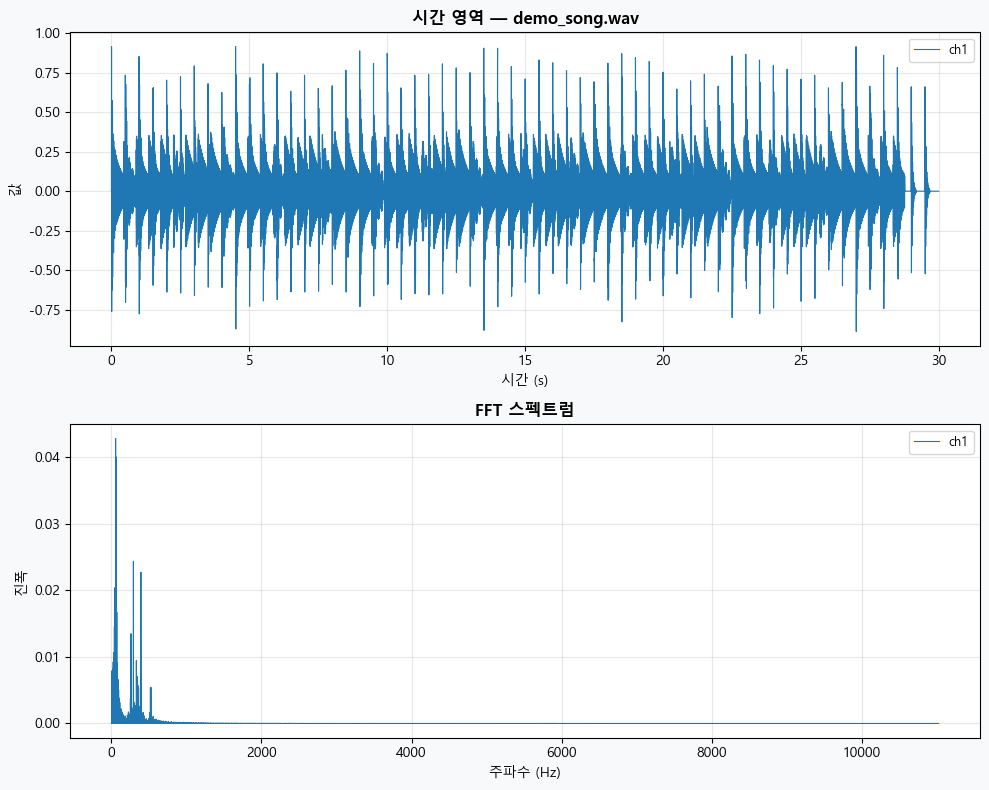 🔍 클릭하면 원본 크기로 보기
README
CSV·엑셀·WAV 어떤 파일이든 열어 신호의 주파수 성분과 주요 피크를 찾아요
CSV·Excel·WAV 파일 (신호 컬럼은 실행할 때 선택)
시간 영역 + FFT 스펙트럼 그래프, 상위 피크 표
science, timeseries
MDS 메이커 | MDS 1.0
# MDS_TITLE: 파일 하나로 FFT 주파수 분석
# MDS_REQUIRES: numpy, pandas, matplotlib, scipy
# MDS_DESC: CSV·엑셀·WAV 어떤 파일이든 열어 신호의 주파수 성분과 주요 피크를 찾아요
# MDS_DESC[en]: Open any CSV/Excel/WAV file and find its frequency components and top peaks
# MDS_TAGS: science, timeseries
# MDS_INPUT: CSV·Excel·WAV 파일 (신호 컬럼은 실행할 때 선택)
# MDS_OUTPUT: 시간 영역 + FFT 스펙트럼 그래프, 상위 피크 표
# MDS_AUTHOR: MDS 메이커
# MDS_VERSION: 1.0
# MDS_DATE: 2026-09-22
#
import os
from scipy.io import wavfile
from scipy.signal import find_peaks
from pandas.api.types import is_numeric_dtype


def load_any_file(path: str) -> tuple[pd.DataFrame, float | None]:
    """파일 확장자에 따라 DataFrame으로 읽는다. WAV는 파일의 샘플링 주파수도 함께 반환."""
    ext = os.path.splitext(path)[1].lower()
    if ext == ".wav":
        fs, data = wavfile.read(path)
        data = np.asarray(data)
        if data.ndim == 1:
            data = data[:, None]
        if data.dtype == np.uint8:
            data = (data.astype(np.float32) - 128.0) / 128.0
        elif np.issubdtype(data.dtype, np.integer):
            data = data.astype(np.float32) / float(np.iinfo(data.dtype).max)
        else:
            data = data.astype(np.float32)
        cols = [f"ch{i + 1}" for i in range(data.shape[1])]
        return pd.DataFrame(data, columns=cols), float(fs)

    loaded = None
    try:
        loaded = mIO.read_from_file(path)
    except Exception:
        loaded = None
    if not isinstance(loaded, pd.DataFrame):
        loaded = pd.read_csv(path, sep=None, engine="python")
    return loaded, None


def ask_settings(data: pd.DataFrame, fs_file: float | None) -> dict | None:
    """분석할 컬럼과 FFT 조건을 한 번에 입력받는다."""
    numeric_cols = [c for c in data.columns if is_numeric_dtype(data[c])]
    if not numeric_cols:
        mIO.print("수치형 컬럼이 없어 FFT를 수행할 수 없습니다.")
        return None

    default_fs = str(fs_file) if fs_file else "1000"
    values = mIO.form([
        {"type": "multicheck", "label": "신호 컬럼", "options": numeric_cols},
        {"type": "combo", "label": "샘플링 기준",
         "options": ["샘플링 주파수 입력", "시간 컬럼에서 계산"], "default": "샘플링 주파수 입력"},
        {"type": "text", "label": "샘플링 주파수(Hz)", "default": default_fs},
        {"type": "combo", "label": "시간 컬럼",
         "options": ["(사용 안 함)"] + numeric_cols, "default": "(사용 안 함)"},
        {"type": "combo", "label": "윈도우",
         "options": ["Hann", "Hamming", "Blackman", "없음"], "default": "Hann"},
        {"type": "check", "label": "평균(DC) 제거", "default": True},
        {"type": "combo", "label": "크기 단위", "options": ["선형 진폭", "dB"], "default": "선형 진폭"},
        {"type": "spin", "label": "피크 표시 개수", "min": 1, "max": 20, "default": 5, "step": 1},
        {"type": "check", "label": "스펙트럼 CSV 저장", "default": False},
    ], title="FFT 설정")
    if values is None:
        return None

    signal_cols = values["신호 컬럼"] or []
    if not signal_cols:
        mIO.print("신호 컬럼을 하나 이상 선택하세요.")
        return None

    if values["샘플링 기준"] == "시간 컬럼에서 계산":
        time_col = values["시간 컬럼"]
        if time_col == "(사용 안 함)":
            mIO.print("시간 컬럼을 선택하세요.")
            return None
        t = pd.to_numeric(data[time_col], errors="coerce").dropna().to_numpy(np.float64)
        if len(t) < 2:
            mIO.print("시간 컬럼의 값이 부족합니다.")
            return None
        dt = float(np.median(np.diff(t)))
        if dt <= 0:
            mIO.print("시간 컬럼이 증가하는 값이 아닙니다.")
            return None
        fs = 1.0 / dt
    else:
        try:
            fs = float(values["샘플링 주파수(Hz)"])
        except (TypeError, ValueError):
            mIO.print("샘플링 주파수는 숫자로 입력하세요.")
            return None
        if fs <= 0:
            mIO.print("샘플링 주파수는 0보다 커야 합니다.")
            return None

    return {
        "signal_cols": signal_cols,
        "fs": fs,
        "window": values["윈도우"],
        "remove_dc": bool(values["평균(DC) 제거"]),
        "use_db": values["크기 단위"] == "dB",
        "n_peaks": int(values["피크 표시 개수"]),
        "save_csv": bool(values["스펙트럼 CSV 저장"]),
    }


def compute_fft(x: np.ndarray, fs: float, window: str, remove_dc: bool) -> tuple[np.ndarray, np.ndarray] | None:
    """단측 진폭 스펙트럼(윈도우 이득 보정)을 계산한다."""
    x = x[np.isfinite(x)]
    n = len(x)
    if n < 2:
        return None
    if remove_dc:
        x = x - x.mean()
    win_funcs = {"Hann": np.hanning, "Hamming": np.hamming, "Blackman": np.blackman}
    win = win_funcs[window](n) if window in win_funcs else np.ones(n)
    spec = np.fft.rfft(x * win)
    amp = np.abs(spec) * 2.0 / win.sum()
    amp[0] /= 2.0
    if n % 2 == 0:
        amp[-1] /= 2.0
    freq = np.fft.rfftfreq(n, d=1.0 / fs)
    return freq, amp


def find_top_peaks(freq: np.ndarray, amp: np.ndarray, n_peaks: int) -> pd.DataFrame:
    """진폭이 큰 순서로 피크 주파수를 뽑는다(DC 제외)."""
    idx, _ = find_peaks(amp)
    if len(idx) == 0:
        idx = np.arange(1, len(amp))
    top = idx[np.argsort(amp[idx])[::-1][:n_peaks]]
    return pd.DataFrame({
        "순위": np.arange(1, len(top) + 1),
        "주파수(Hz)": np.round(freq[top], 4),
        "진폭": amp[top],
    })


def thin(arr: np.ndarray, max_points: int = 20000) -> np.ndarray:
    """그래프 표시용으로 점 개수를 줄인다."""
    step = max(1, len(arr) // max_points)
    return arr[::step]


def plot_results(signals: dict, spectra: dict, fs: float, use_db: bool, title: str) -> None:
    plt.rcParams['font.family'] = 'Malgun Gothic'
    plt.rcParams['axes.unicode_minus'] = False

    fig, (ax_t, ax_f) = plt.subplots(2, 1, figsize=(10, 8))
    for col, x in signals.items():
        t = np.arange(len(x)) / fs
        ax_t.plot(thin(t), thin(x), linewidth=0.8, label=col)
    ax_t.set_title(f"시간 영역 — {title}", fontsize=12, fontweight='semibold')
    ax_t.set_xlabel("시간 (s)")
    ax_t.set_ylabel("값")
    ax_t.grid(True, alpha=0.3)
    ax_t.legend(fontsize=9)

    for col, (freq, amp) in spectra.items():
        y = 20.0 * np.log10(amp + 1e-12) if use_db else amp
        ax_f.plot(thin(freq), thin(y), linewidth=0.8, label=col)
    ax_f.set_title("FFT 스펙트럼", fontsize=12, fontweight='semibold')
    ax_f.set_xlabel("주파수 (Hz)")
    ax_f.set_ylabel("진폭 (dB)" if use_db else "진폭")
    ax_f.grid(True, alpha=0.3)
    ax_f.legend(fontsize=9)

    plt.tight_layout()
    plt.show()
    plt.close(fig)


def save_spectrum_csv(spectra: dict) -> str | None:
    save_path = mIO.save_file(dialog_title="스펙트럼 저장", file_filter="CSV (*.csv)", initial_dir=None)
    if not save_path:
        return None
    parts = [pd.DataFrame({"신호": col, "주파수(Hz)": freq, "진폭": amp})
             for col, (freq, amp) in spectra.items()]
    out = pd.concat(parts, ignore_index=True)
    out.to_csv(save_path, index=False, encoding="utf-8-sig")
    del out
    return save_path


def run_fft(df: pd.DataFrame) -> str:
    path = mIO.open_file_single(
        dialog_title="FFT할 파일 선택",
        file_filter="데이터 파일 (*.csv *.xlsx *.xls *.json *.txt *.wav);;모든 파일 (*.*)",
        initial_dir=None,
    )
    if not path:
        return "파일 선택이 취소되었습니다."

    try:
        data, fs_file = load_any_file(path)
    except Exception as e:
        mIO.print(f"파일을 읽을 수 없습니다:\n{e}")
        return "파일 읽기 실패"
    if data is None or data.empty:
        mIO.print("파일에 데이터가 없습니다.")
        return "빈 파일"

    settings = ask_settings(data, fs_file)
    if settings is None:
        return "사용자가 취소했습니다."

    fs = settings["fs"]
    signals: dict = {}
    spectra: dict = {}
    peak_parts = []
    for col in settings["signal_cols"]:
        x = pd.to_numeric(data[col], errors="coerce").to_numpy(np.float64)
        res = compute_fft(x, fs, settings["window"], settings["remove_dc"])
        if res is None:
            continue
        freq, amp = res
        signals[col] = x[np.isfinite(x)]
        spectra[col] = (freq, amp)
        peaks = find_top_peaks(freq, amp, settings["n_peaks"])
        peaks.insert(0, "신호", col)
        peak_parts.append(peaks)
    del data

    if not spectra:
        mIO.print("유효한 데이터가 2개 이상인 컬럼이 없습니다.")
        return "FFT 대상 없음"

    saved = save_spectrum_csv(spectra) if settings["save_csv"] else None

    file_name = os.path.basename(path)
    plot_results(signals, spectra, fs, settings["use_db"], file_name)
    peak_df = pd.concat(peak_parts, ignore_index=True)
    mIO.show_df(peak_df, title=f"주요 피크 — {file_name}")

    n_max = max(len(v) for v in signals.values())
    msg = f"{file_name}: {len(spectra)}개 신호 FFT 완료 (fs={fs:g} Hz, 최대 {n_max:,}샘플, 분해능 {fs / n_max:.4g} Hz)"
    if saved:
        msg += f"\n스펙트럼 저장: {saved}"
    return msg


result = run_fft(df)